
TL/DR
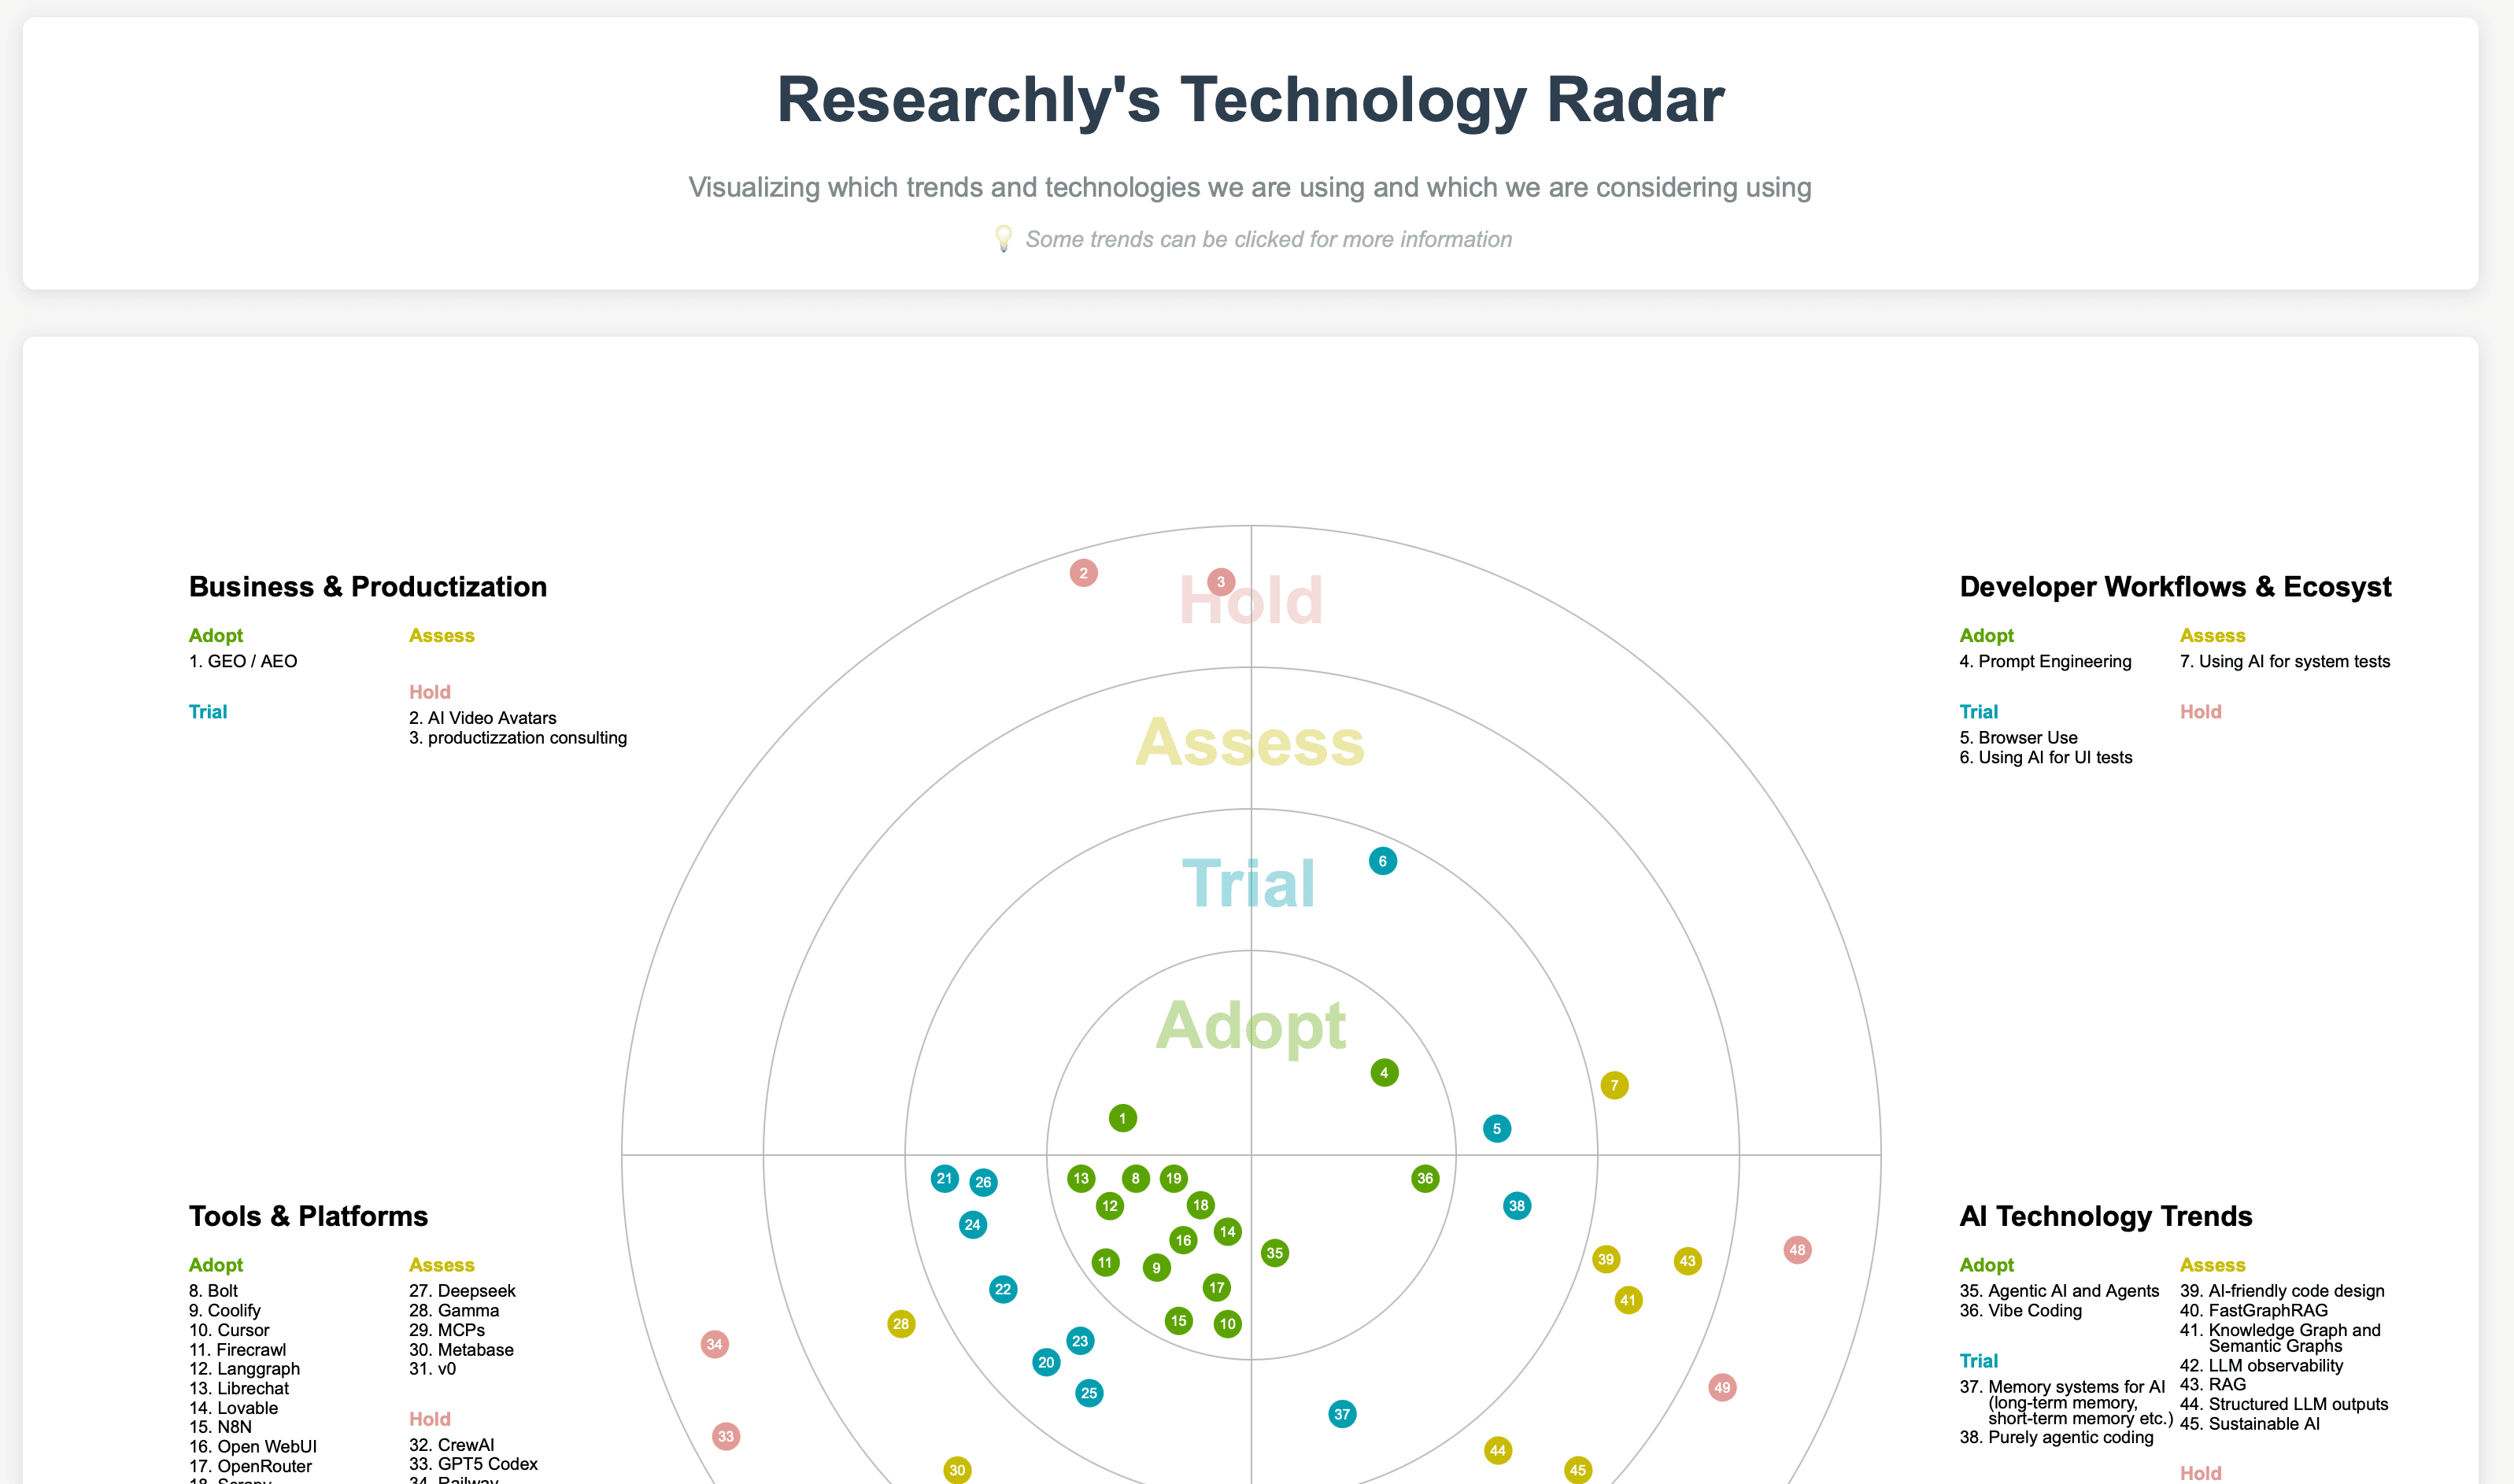
A technology radar is a strategic tool that systematically monitors and assesses emerging trends. We built our own radar to track AI developments—and you can too. This guide walks you through our exact process: identifying trends, defining categories and scoring dimensions, gathering evidence from multiple sources, and automating the entire workflow with N8N. You'll find our live technology radar here and a free N8N template at the end.
Content
- Why (Even) Startups Need a Technology Radar
- Step 1: Identify the Trends You Want to Track
- Step 2: Define Trend Categories
- Step 3: Define Your Scoring Dimensions
- Step 4: Identify Your Sources & Gather Evidence
- Step 5: Score Each Trend with a Scorecard
- Step 6: Calculate Overall Scores & Place Trends into Radar Rings
- Step 7: Keep Your Radar Current
- Step 8: Make Adoption Triggers Explicit
- Inspiration: Enterprise Technology Radars
- Build your own Technology Radar wit Researchly
- FAQ: Building a Technology Radar
Why (Even) Startups Need a Technology Radar
Technology radars are traditionally associated with large enterprises like BMW or DHL. For startups in fast-moving fields like AI, a structured radar is equally valuable—arguably more so, since you have less margin for error when betting on the wrong technology.
A radar helps you:
- Prioritize R&D investments based on systematic evidence, not gut feeling
- Spot emerging trends before competitors
- Communicate tech strategy to investors, partners, and your team
We developed our own radar at Researchly to track AI trends. Below is the exact methodology—plus a free N8N workflow so you can build a simpler version yourself.
Step 1: Identify the Trends You Want to Track
 First, you need a list of trends to monitor.
In our case, we were already tracking relevant topics, so we collected them into a database.
If you don't have a list, try:
- Brainstorming with your team (or use ChatGPT as a sparring partner)
- Web searches for "trending [your domain]"
- Internal communication mining: Scan Slack, email, or Discord for repeated mentions of new ideas
Alternative: Reverse Trend Search
Normally, you list known trends and assess their impact. But there's value in searching broadly for anything that might affect your business—including patents, academic papers, or regulatory changes outside your usual bubble. This approach can uncover unique angles others miss. For more on this, see our guide on Horizon Scanning.
Step 2: Define Trend Categories
Group your trends into big-picture categories relevant to your context. A "trend" can be technical, business-related, or social.
Our categories:
| Category | Description |
|---|---|
| AI Technology Trends | Advances in AI and adjacent fields |
| Tools & Platforms | Frameworks, SaaS, libraries enabling AI & dev workflows |
| Business & Productization | New business models, enterprise usage, consulting trends |
| Developer Workflows & Ecosystems | How developers build, test, and interact with AI tools |
Pro-Tipp: We automated this categorization step in N8N, making it easy to classify new trends as they emerge. The workflow is at the end of this post.
Step 3: Define Your Scoring Dimensions
To assess each trend objectively, evaluate it from several angles. Our main dimensions are:
| Dimension | What it measures |
|---|---|
| Impact | How much value could this trend bring? (productivity, revenue, compliance) |
| Adoption / Maturity | How widely is it currently used or explored? |
| Risk | Security, compliance, ethical risks; implementation difficulty |
Adjust these dimensions to fit your industry. For heavily regulated sectors, "Regulatory Exposure" might be a fourth dimension.
Step 4: Identify Your Sources & Gather Evidence
Track each trend across multiple sources. High-value sources for tech trends include:
| Source Type | Examples | Why it matters |
|---|---|---|
| Social Media | Reddit, Twitter/X, LinkedIn | Early signals, community sentiment |
| Open Source | GitHub | Projects often lead commercial tools by months |
| Academic Papers | arXiv, Semantic Scholar | Cutting-edge research, future productization |
| Patents | Espacenet, Google Patents | Signals corporate R&D direction |
| Financial Reports | Earnings calls, SEC filings | Market validation, enterprise adoption |
| News & Industry Reports | TechCrunch, Gartner | Market impact, competitive context |
Template for Evidence Gathering
Use structured queries like:
"Give me data from [source] regarding the [dimension] of [trend]."
Example:
"Show evidence from Reddit about market adoption of AI agents."
Organize all evidence per trend and dimension. Track the source so you can connect specific signals to your scoring later.
We use Researchly's Trend Analyzer for automated evidence collection, but you can start manually with Google Sheets and N8N.
Step 5: Score Each Trend with a Scorecard
With evidence in hand, assess each trend using a consistent 1–5 scale. Define what each score means for every dimension.
Example Scorecard for Impact:
| Score | Meaning |
|---|---|
| 1 | No clear impact; barely any credible evidence |
| 3 | Quantified improvement in case studies or pilots (e.g., "15% efficiency gain") |
| 5 | Validated by benchmarks or meta-studies; becoming industry standard |
Create similar rubrics for Adoption/Maturity and Risk. This keeps your radar systematic instead of subjective.
Step 6: Calculate Overall Scores & Place Trends into Radar Rings
Sum or weight the dimension scores to get an overall score per trend. This determines placement on your radar.
Example Radar Rings:
| Score Range | Ring | Action |
|---|---|---|
| 3–6 | HOLD | Monitor—don't act yet |
| 7–9 | ASSESS | Evaluate more closely |
| 10–12 | TRIAL | Pilot on a small scale |
| 13–15 | ADOPT | Make part of your product/process |
Place high-promise trends in the center; less mature or less relevant ones on the periphery.
Step 7: Keep Your Radar Current
Tech moves fast. We refresh our radar weekly with an automated workflow and track changes plus underlying reasons. For automation strategies, see our guide on N8N and KI-Agenten.
Step 8: Make Adoption Triggers Explicit
For each trend, document what would need to happen for you to adopt it.
Questions to answer:
- What are the blockers? (maturity, compliance, skills)
- Which concrete metrics would tip the scales? (e.g., "Two competitors successfully launch a product using this technology")
Making these trigger conditions explicit helps you reevaluate trends methodically as circumstances change—similar to defining investment theses in Deal Sourcing with AI.
Inspiration: Enterprise Technology Radars
We drew inspiration from established enterprise radars:
| Company | Radar | Focus |
|---|---|---|
| BMW | Technology Trend Radar | Automotive innovation |
| DHL | Logistics Trend Radar | Supply chain & logistics |
| Zalando | Tech Radar | Engineering tools & practices |
What tools do I need to build a technology radar?
You can start with:
- Google Sheets for tracking trends and scores
- N8N for automation (free workflow below)
- Researchly for automated evidence gathering and trend analysis
How do I decide which trends to track?
Start with trends directly relevant to your product or market. Then expand to adjacent areas (regulations, competitor moves, academic research). Use the "reverse trend search" method to find unexpected signals.
Conclusion
- A technology radar is not just for enterprises—startups gain strategic clarity by systematically tracking trends.
- Automation is key: Use N8N and structured templates to keep your radar current without manual overhead.
- Define explicit adoption triggers so you can act decisively when conditions change.
Next Step: Build your own technology radar—without weeks of manual research?
The biggest hurdle in building a radar is not the methodology, but the continuous collection of data. While you were reading this article, new papers were published on arXiv, new GitHub projects were launched, and earnings calls were released.
Researchly's Trend Analyzer automates this very step: It systematically searches academic sources, patents, GitHub, and financial data—and provides you with ready-to-evaluate evidence packages for each trend. Instead of investing 10 hours a week in monitoring, you invest 30 minutes in strategic decisions.
No credit card required. Includes access to our trend database with 500+ pre-analyzed AI trends.